QIQO 1B
A hot, natural, energy drink
225,000 €
total amount raised
- Eligible for a tax reduction
This campaign has been closed
Historical accounts
QIQO BVBA was incorporated in March 2016. As we had first sales in 2017, it was deciced to do a prolonged first accounting year. The first P&L and balance sheet , will be finalized on 31/12/2017.
Financial plan
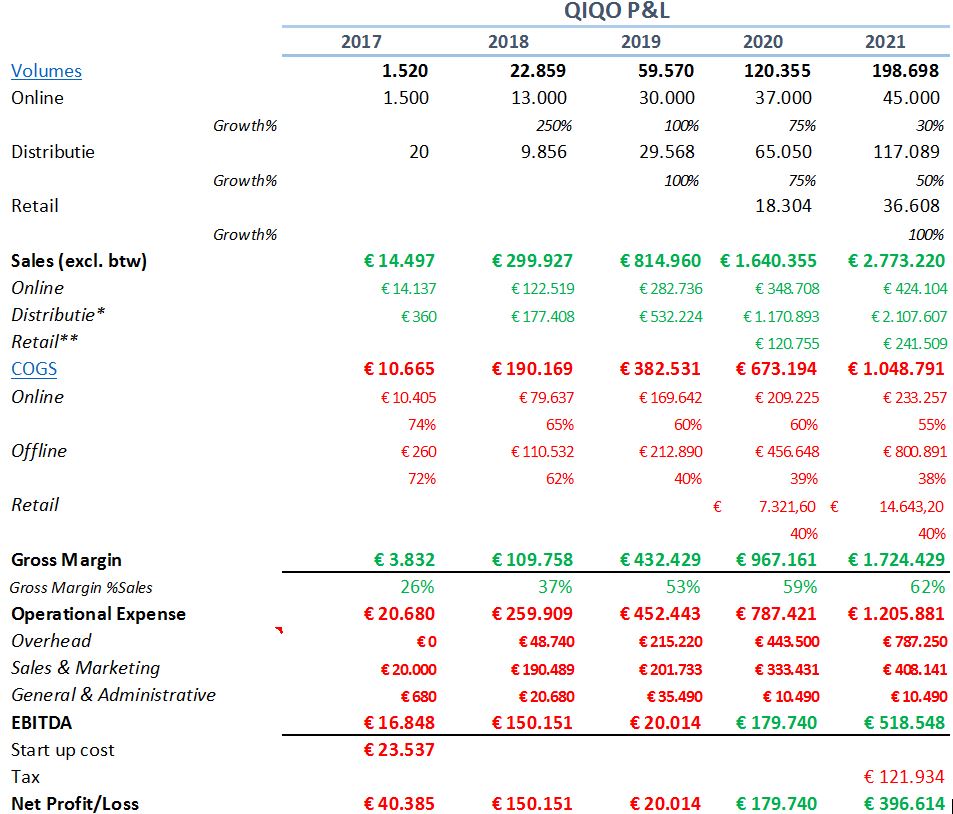
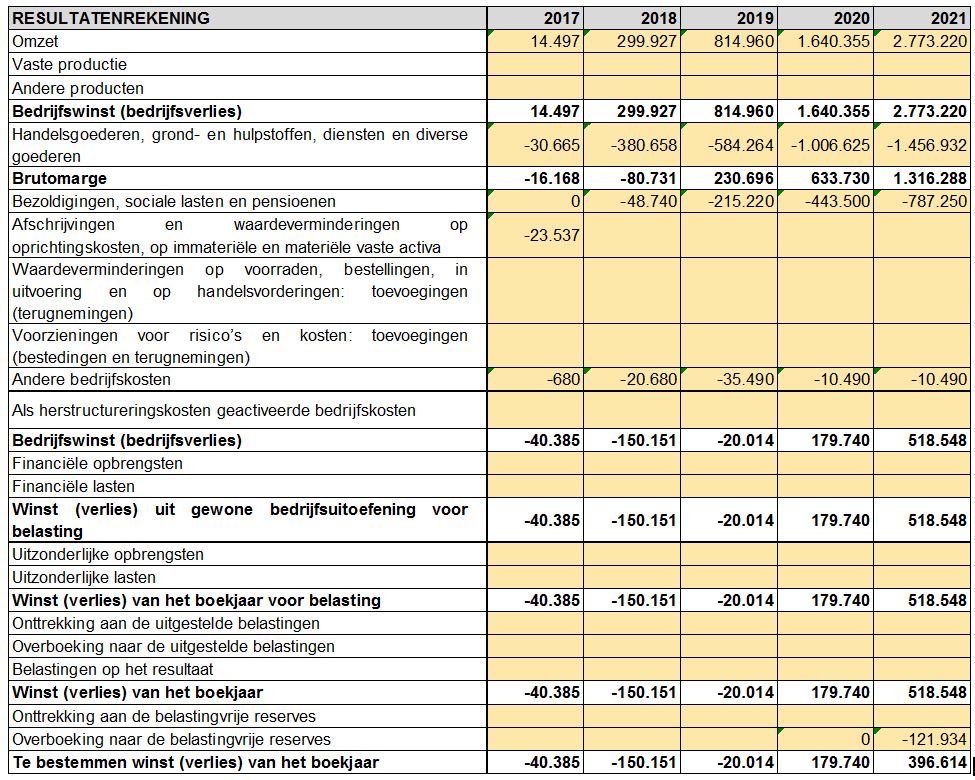
The 5-year financial plan, developed by QIQO's management team, is presented here below.
All input is coming from the revenue & cost drivers, which are also explained below.
In 2021, QIQO will have a turn-over of 2,7EUR MIO, at a gross margin of 62% and an EBITDA margin of 19%.
All input is coming from the revenue & cost drivers, which are also explained below.
In 2021, QIQO will have a turn-over of 2,7EUR MIO, at a gross margin of 62% and an EBITDA margin of 19%.
Revenue drivers
QIQO VOLUMES GENERAL
- All volumes are based on a bottom-up forecast.
- Assumptions for bottom-up forecast are based on QIQO results so far, complemented by industry standards.
- Price B2B box (excl. TVA) = 18EUR
- Price B2C box (excl. TVA) = 9,42EUR
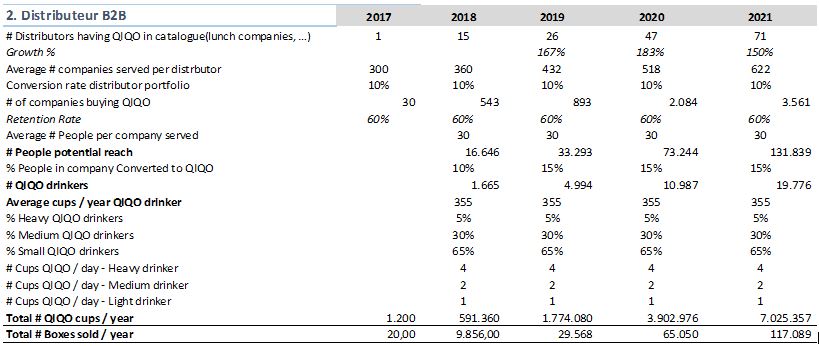
B2B VOLUMES BOTTOM-UP
- Starting from # distrubutors selling QIQO to companies
- Calculate # companies serving QIQO to employees, based on conversion rate of distributors
- Assuming average consumption per company, we know the amount of QIQO sold per year by distributors
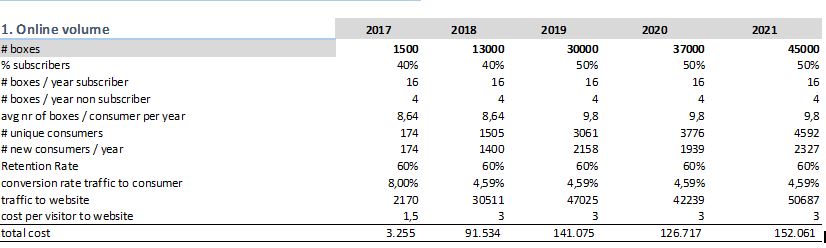
ONLINE VOLUMES BOTTOM-UP
- Starting from an estimated cost per visitor to the website
- Knowing our marketing investment, we know the number of visitors to our website
- Based on the conversion rate & retention rate, we know our forecast of # of customers
- We split customers in subscribers & non-subscribers, based on current split of customer base QIQO
- All volumes are based on a bottom-up forecast.
- Assumptions for bottom-up forecast are based on QIQO results so far, complemented by industry standards.
- Price B2B box (excl. TVA) = 18EUR
- Price B2C box (excl. TVA) = 9,42EUR
B2B VOLUMES BOTTOM-UP
- Starting from # distrubutors selling QIQO to companies
- Calculate # companies serving QIQO to employees, based on conversion rate of distributors
- Assuming average consumption per company, we know the amount of QIQO sold per year by distributors
ONLINE VOLUMES BOTTOM-UP
- Starting from an estimated cost per visitor to the website
- Knowing our marketing investment, we know the number of visitors to our website
- Based on the conversion rate & retention rate, we know our forecast of # of customers
- We split customers in subscribers & non-subscribers, based on current split of customer base QIQO
Cost drivers
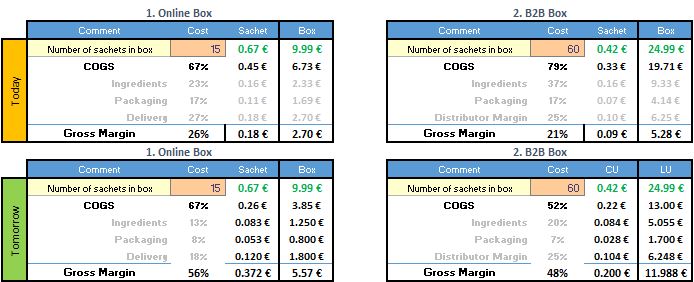
COST OF GOODS SOLD
- Based on current actuals & price lists suppliers
- Increasing volumes provide significant gains in margin, based on actual price lists of suppliers
- Based on current actuals & price lists suppliers
- Increasing volumes provide significant gains in margin, based on actual price lists of suppliers
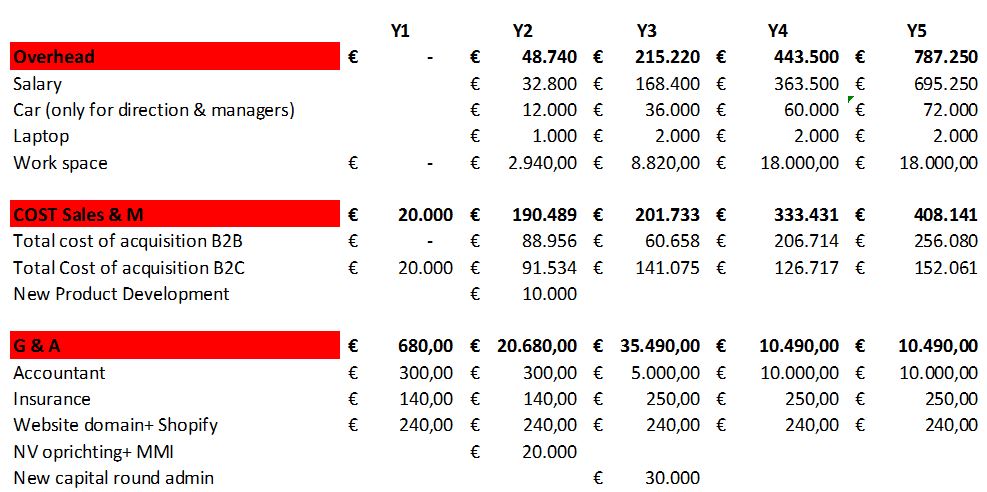
Operational expenses
- Overhead: based on indsutry standard salaries and FTE plan which will support the foreseen growth
- Sales & Marketing:
- B2B = cost of acquisition per company X # companies
- B2C = cost of acquisition per consumer X # consumers
- General & Administrative: based on actuals + price lists suppliers
- Overhead: based on indsutry standard salaries and FTE plan which will support the foreseen growth
- Sales & Marketing:
- B2B = cost of acquisition per company X # companies
- B2C = cost of acquisition per consumer X # consumers
- General & Administrative: based on actuals + price lists suppliers
Financial tables

Break even volume
Without planned marketing investments: 2,2K boxes.Taking into account all growth and marketing investments planned, as described in the financial plan: 275k boxes